Observability where AI finds the anomaly, engineered to hold at national scale.
SquareShift is a certified Elastic observability practice. We unify logs, metrics, and traces into one AI-driven signal — anomaly detection, automated root cause, and the noise cut down — held at national and critical-infrastructure scale.
02 Credentials


Elastic-certified engineering depth
 Elastic Certified Observability Engineer
 Elastic Certified Engineer
 Elastic Certified Analyst
 Elastic Certified SIEM Analyst
Delivered production observability at national-infrastructure scale — for government health networks, a national digital-ID program, and critical infrastructure that can't go dark.
AI does the watching. Our engineering makes it trustworthy.
Two engineering problems, one practice — what AI now does in observability, and the full-stack work that makes it trustworthy enough to run on.
AI-driven observability
The system watches itself — flags the anomaly, cuts the noise, and hands your team the root cause.
- AIOps & Noise SuppressionAI-driven anomaly detection and automated triage that cut the noise before a human opens a dashboard.
- ML-Based Anomaly DetectionModels trained on your own logs and metrics, not static thresholds that miss what's actually wrong.
- Automated Root Cause & Blast-Radius SimulationTrace a failure back to its source, and simulate how far it would spread, before it does.
- Observability for AI AppsLatency, cost, token usage, and output quality for the LLM apps you're already shipping.
- Observability for AI in Software EngineeringVisibility into how AI coding tools perform across your engineering pipeline.
- GenAI-Assisted InvestigationElastic's AI Assistant answers a natural-language question over your own logs, metrics, and traces — a grounded answer, not just a graph.
Full-stack observability engineering
The foundation the AI runs on — unified, instrumented, and secured end to end.
- Logs, Metrics & Traces UnifiedOne platform instead of a patchwork of point tools for logs, metrics, and traces.
- Application Performance Monitoring (APM)Requests, response times, and error rates traced end to end across your services.
- Infrastructure, Real-User & Synthetic MonitoringServer, container, and cloud metrics next to what your real users experience.
- Dashboards & Alerting (Kibana)Role-based dashboards and alerting tuned to what each team actually owns.
- Log Pipeline & Migration EngineeringLogstash tuning and migrations off Splunk, Graylog, or legacy Elasticsearch, held live throughout.
- Air-Gapped, On-Prem & Multi-Cloud DeploymentFully air-gapped, national-scale on-prem, or hybrid observability, secured end to end.
04 Prebuilt AI products
Two prebuilt products, ready to point at your problem — live in days on the Elastic you already run.
 Compass AI
Observability for AI-enabled software engineering
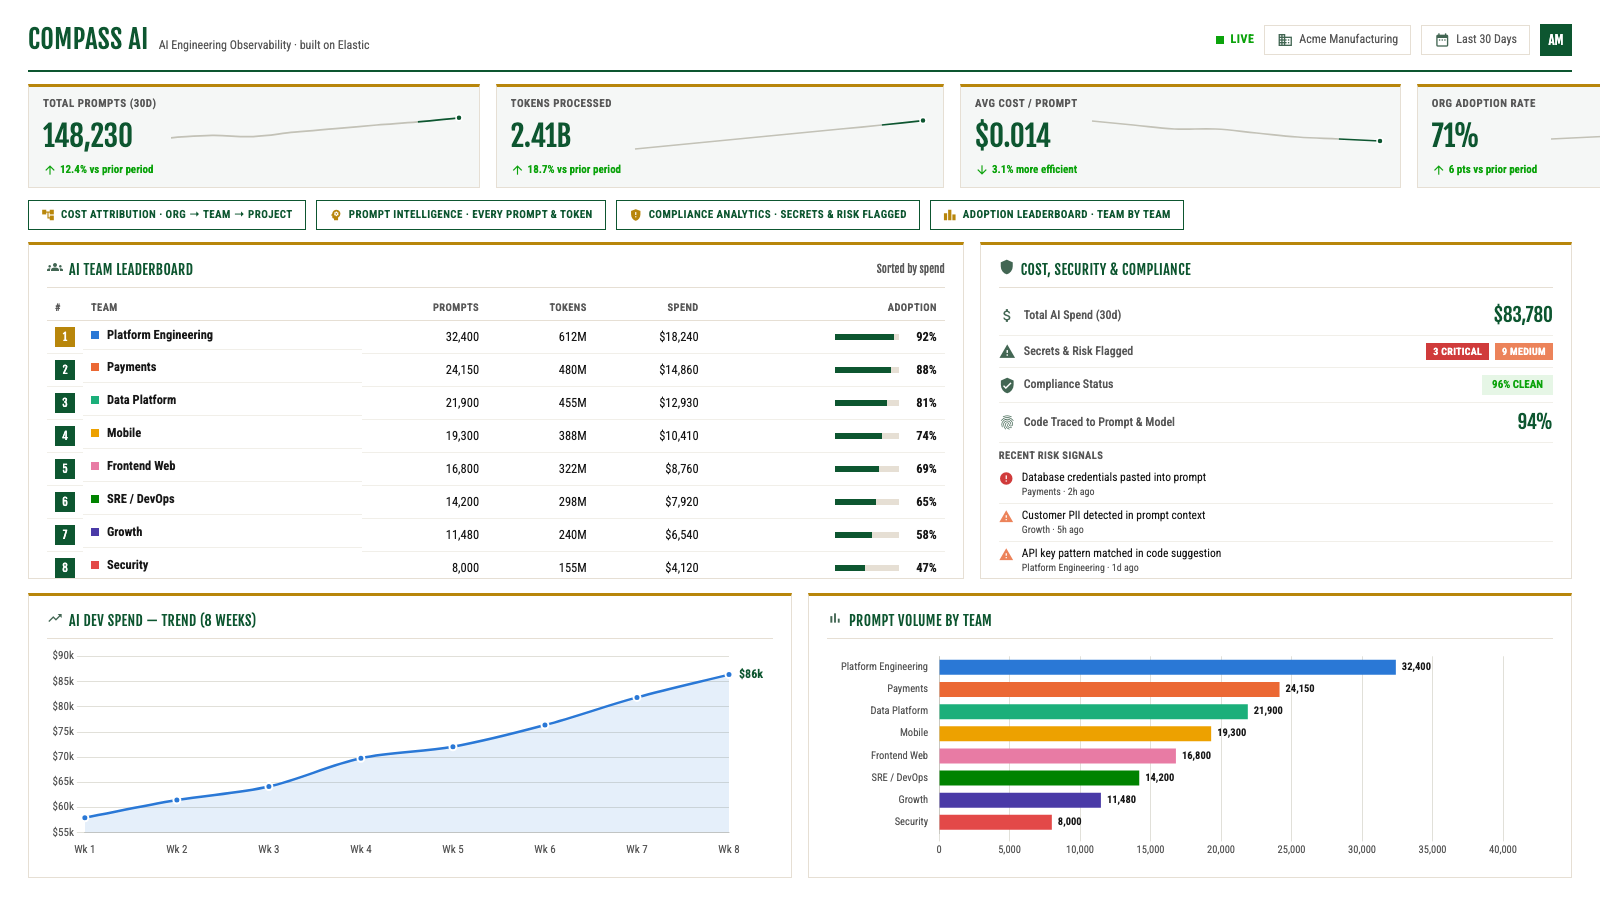
Every prompt your engineers write has a cost and a risk. Compass AI makes both visible, on the Elastic you already run.
Stop runaway AI spend.
See which models each engineer uses — and what they cost — day by day, long before the invoice lands.
Catch leaks before they ship.
Every prompt inspected for secrets, API keys, and sensitive data — and flagged before any of it leaves.
Keep regulated data out of public models.
Compliance analytics stops PII and confidential data before it ever reaches an external LLM.
Turn “AI-native” into a number.
See which engineers use AI well, team by team — then spread what the best are doing to everyone.
 Atlas AI
Observability for all AI applications
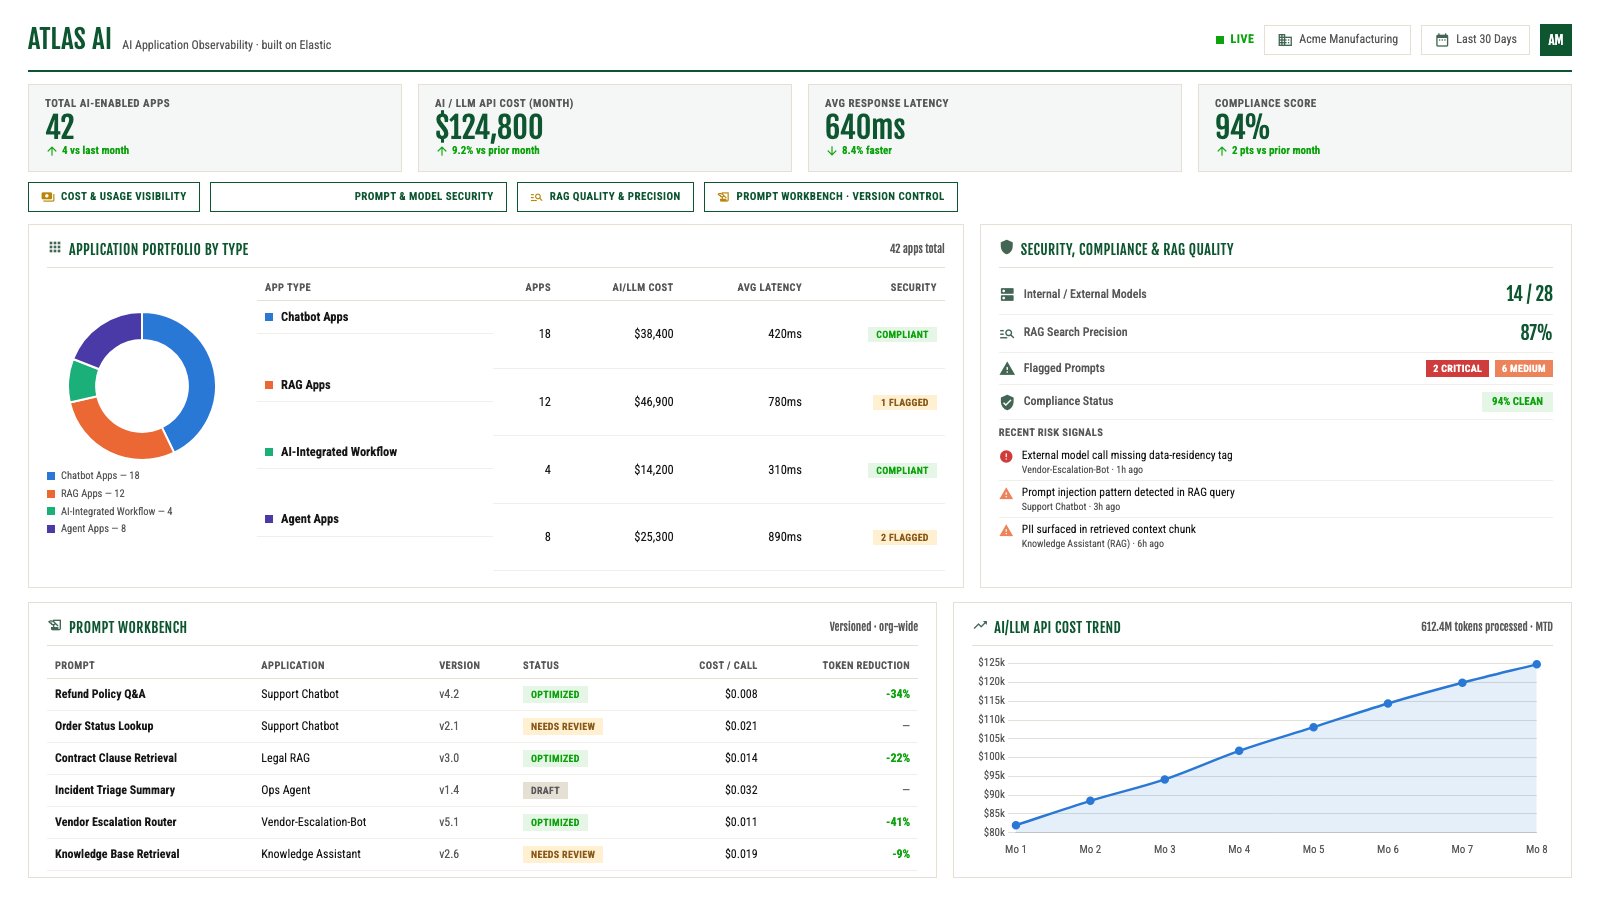
Every AI application you've shipped has a cost, a security surface, and a quality bar. Atlas AI makes all three visible, on the Elastic you already run.
See what every AI app really costs.
Atlas tracks AI and LLM API spend across every application and model — the full cost, in one view.
Lock down what your AI apps expose.
Inspect the prompts and data each app uses — across the models you host and the ones you don't.
Trust every answer your AI ships.
Measure retrieval precision, answer usefulness, and availability — so RAG quality is proven, not assumed.
Run every prompt like production code.
The Prompt Workbench versions every prompt across the org and tunes each one for cost, tokens, and speed.
The Elastic observability we've delivered.
AIOps, national-scale on-prem, air-gapped critical infrastructure, ML-driven alerting, pipeline reliability, and migrations held live throughout — across healthcare, government, financial services, and logistics.
National public-sector healthcare network — unified 14 mixed-protocol network and security devices into one AIOps platform ingesting roughly 10 million events a minute, with 35 role-based dashboards across teams.
Read the case study National scaleOne of the world's largest digital-identity programs — on-premise observability across two data centers in active-active HA, sized for 1.5TB/day ingestion and 270TB retention.
Read the case study Air-gappedCritical-infrastructure operator — a fully air-gapped Elastic Stack v9.0.1 deployment meeting a mandatory one-year log-retention rule, secured with LDAP-based access control and CA-signed TLS end to end.
Read the case study ML alertingGlobal digital financial-services provider — consolidated disparate monitoring tools onto Elastic Cloud with GitOps-managed configuration, ML-based alerting, and role-scoped Kibana spaces per team.
Read the case study Pipeline reliabilityCanadian multinational bank, 12M+ customers — audited and standardized Logstash pipelines processing 50M+ events a day, raising parsing accuracy and cutting memory use.
Read the case study MigrationLogistics and transportation company, 1M+ shipments a year — migrated a 7TB+ cluster from Elasticsearch 1.x to 8.x with just 3 hours of downtime, cutting storage cost 60% with frozen-tier data.
Read the case studyStart with a free AIOps proof of concept.
Most engagements start with a free, one-week proof of concept or assessment — before you commit to a build.
AIOps
AI-driven anomaly detection, noise suppression, and automated triage across your logs, metrics, and traces.
- One week against a slice of your real telemetry
- See the noise drop before you commit
Observability for AI apps
Monitoring for LLM and AI applications — latency, cost, token usage, and output quality in production.
- One week to instrument one AI app
- Stand up the dashboards in real conditions
Managed operations
Senior Elastic engineers who run the system with you after go-live — not a ticket queue.
- Free review of how you run Elastic today
- Ongoing engagement scoped to fit
Elastic health check
A senior review of performance, cost, reliability, and architecture risk — before it becomes an incident.
- One week, senior-led
- Written findings and risk report you can act on
Performance tuning
Restoring query speed and cluster performance under real production load.
- A senior diagnostic of what's slowing your cluster
- Tuning work scoped from there
Migration advisory
A plan to move off Splunk, Datadog, Graylog, self-managed Elasticsearch, or another platform, with the risks mapped before you commit.
- One week to a plan
- Source-by-source risks, sequence, and effort
- Before you move anything
Got an observability problem? Bring it to us — we'll get you a signal you can trust.
Talk to an observability specialist